
Automated SEO Reporting for Large Teams (Case Data)
“
Automated SEO Reporting for Large Teams: 3 Case Examples + a Repeatable Ops Playbook
Automated SEO reporting for large teams usually fails for a simple reason: the reporting problem isn’t “we need a nicer dashboard.” It’s that the team can’t reliably turn search data into decisions across multiple squads, stakeholders, and markets—without someone scrambling every week to reconcile definitions, rebuild decks, and answer the same ad-hoc questions.
That gap between data and execution is an operations problem. If you want the broader operating model (roles, cadence, KPI governance, and decision workflows), start with the SEO Operations Playbook for teams and KPIs.
This article is the field guide specifically for reporting automation at scale: what breaks, what “automation” really means, three believable before/after examples (with measurable outcomes), and a repeatable playbook you can pilot without boiling the ocean.
Why automated SEO reporting breaks at scale (and what to fix first)
The Operations Gap in reporting: disconnected tools, manual pulls, and KPI drift
Large SEO orgs don’t suffer from a lack of data. They suffer from the Operations Gap—the missing system between “metrics exist somewhere” and “teams consistently act on them.” In practice, that looks like:
-
Disconnected sources and definitions: one squad reports “organic sessions,” another reports “non-brand clicks,” and leadership gets a blended story that changes month to month.
-
Manual assembly: someone exports, cleans, screenshots, and pastes into slides every week.
-
KPI drift: metrics evolve quietly (filters, segments, attribution windows), so trends become untrustworthy.
-
No decision workflow: the report exists, but it doesn’t reliably create tickets, content priorities, or engineering actions.
Fix the system first: KPI governance, owners, cadence, and “what changed / what we’ll do next.” Tools come after.
What “automation” actually means for large teams (not just a dashboard)
For large teams, automation isn’t “we built a dashboard.” It’s a reporting system that:
-
Standardizes KPI definitions (a KPI contract everyone references).
-
Refreshes on a dependable cadence (daily/weekly/monthly, by metric type).
-
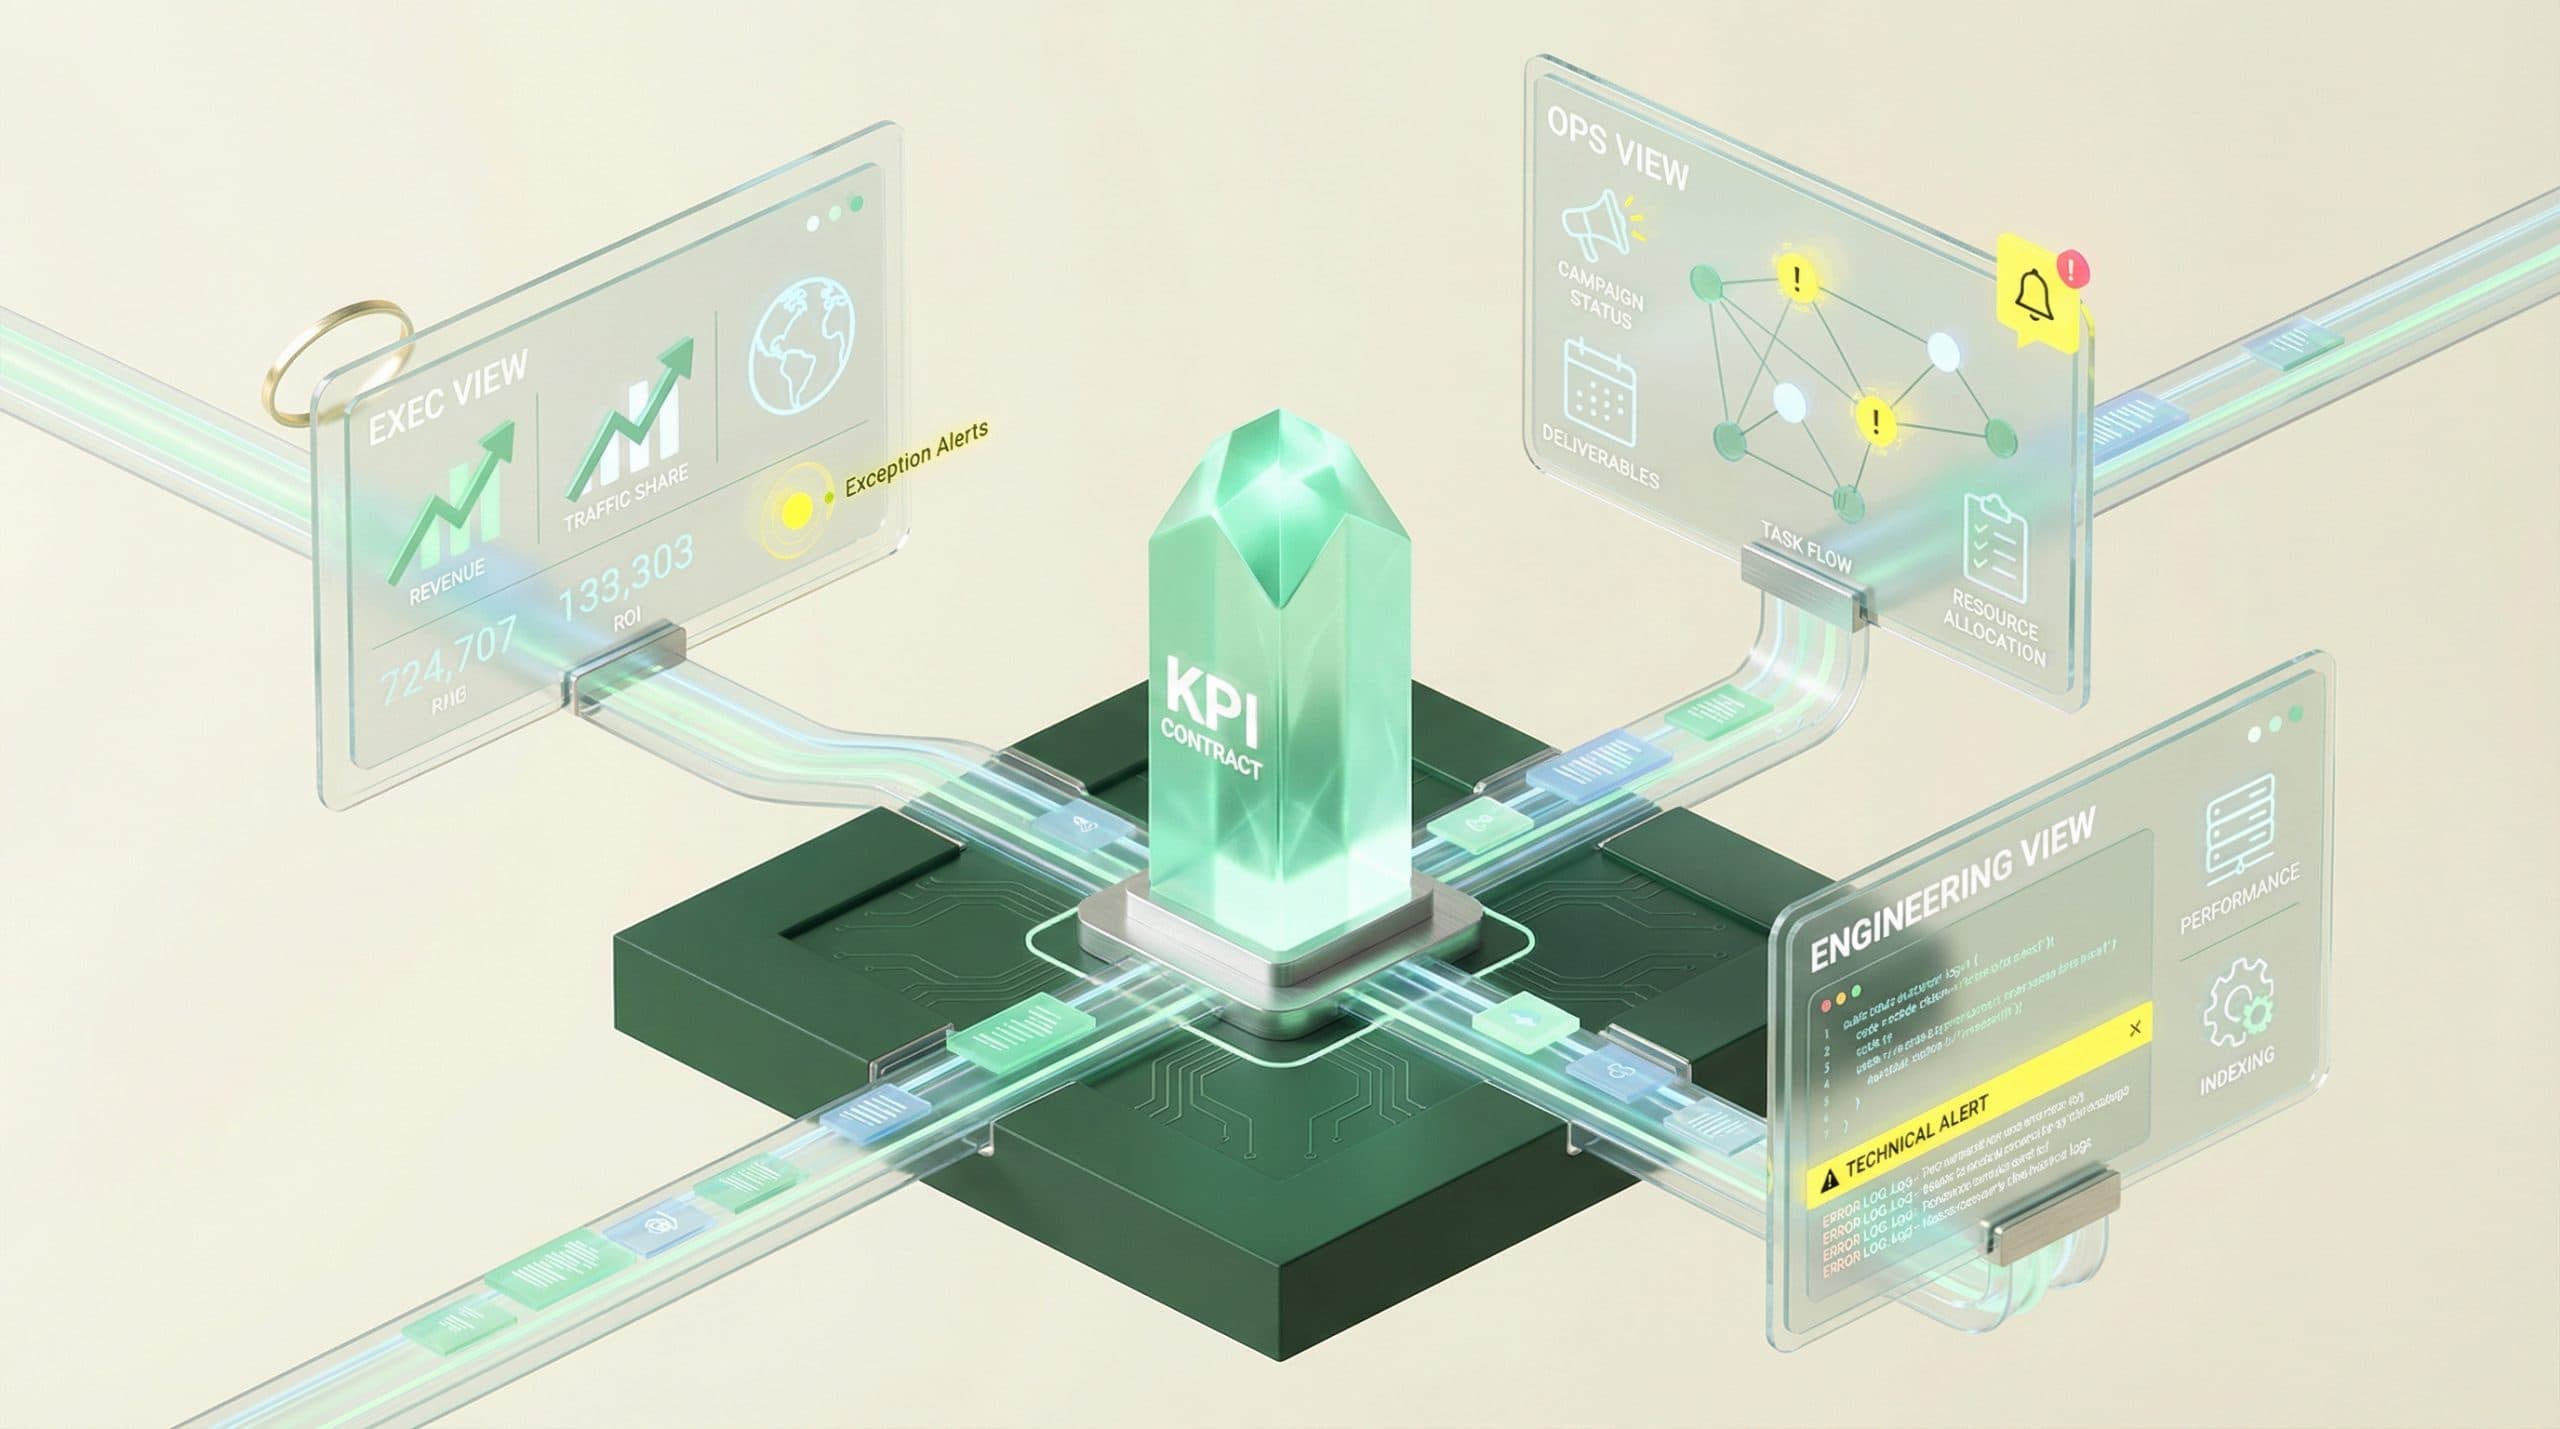
Publishes role-based views (exec vs. content vs. engineering, etc.).
-
Produces an action-oriented narrative: what changed, why it matters, what we do next, who owns it.
-
Uses exception-based reporting so attention goes to anomalies and priorities—not endless charts.
The minimum viable automated reporting system (MVARS) for large teams
MVARS is the smallest system that removes weekly scramble, reduces ad-hoc requests, and increases decision speed—without over-engineering.
One source of truth: definitions, owners, and refresh cadence
Start with a KPI contract and treat it like a product spec. It’s short, explicit, and owned.
-
Metric name (exact label used in reports)
-
Definition/formula (including segments like non-brand vs. brand)
-
Data source (system of record)
-
Owner (who approves changes)
-
Refresh cadence (daily/weekly/monthly)
-
“What changed” rules (thresholds for highlighting movement)
Stakeholder views: Exec, SEO leadership, Content, Engineering, Local/Category owners
Large-team reporting works when each audience gets the same KPI truth, but in the view that matches their decisions. Here’s a practical split:
StakeholderDecisions they makeWhat they need to see weeklyExecsInvestment, risk, priority tradeoffsOutcome trend + top drivers + top risks + next actionsSEO leadershipRoadmap, resource allocation, sequencingKPI ladder + initiative status + exceptions/anomaliesContent teamWhat to publish/update, where to focusContent velocity, coverage, performance cohorts, opportunitiesEngineering/PlatformWhat to fix, when, and why it mattersIndexation/crawl health, error trends, impact windows, SLALocal/Category ownersMarket/category priorities and accountabilityRollups + drilldowns, market exceptions, owners and due dates
The KPI ladder: leading indicators → outcomes → ROI narrative
A KPI ladder prevents the classic failure mode where leadership asks for revenue, teams show rankings, and nobody connects the dots. Use a three-rung structure:
RungPurposeExample KPIsLeading indicatorsEarly signal that work is workingIndexation coverage, technical health trends, visibility/ranking cohorts, CTR trends, content velocityOutcomesBusiness impact proxy from SEONon-brand clicks/traffic, engaged sessions, conversions (where tracked), assisted conversionsROI narrativeExplain “why this moved” and “what we did”Initiative timeline, pre/post windows, decision log, risk/mitigation
When MVARS is working, the weekly report becomes a decision artifact, not a compilation project. If you’re standardizing this across reporting, workflows, and publishing, a platform approach can help—e.g., the Go/Organic SEO Operating System for unified reporting, content, and publishing is designed to connect measurement to execution without treating reporting as a standalone activity. (No matter what you use, the operating model above is the real unlock.)
CTA: See how the SEO Operating System unifies reporting with execution
Case example 1 — Weekly exec reporting without the scramble
Before: manual deck building + inconsistent KPI definitions
A central SEO lead is responsible for a weekly exec update. Inputs arrive from multiple squads (content, tech, local), each with different definitions and time windows. Wednesday night becomes: export, reconcile, build slides, and prepare for “what changed?” questions that require more pulls.
Typical symptoms:
-
[6–12 hours/week] spent building the deck and validating numbers
-
Same questions repeated: “Is that non-brand?” “Why does this not match last week?”
-
Decisions delayed to “next week” because the story isn’t stable
After: automated narrative + stable KPI glossary + exception-based alerts
The team implements MVARS for the exec view:
-
A KPI contract defines the 8–12 exec metrics (and exactly how they’re calculated).
-
A narrative template auto-populates: trend, top drivers, and what changed beyond thresholds.
-
Exceptions trigger notes and owners: “investigate,” “ship fix,” “update content cluster,” etc.
Data to include: hours saved/week, time-to-decision, number of ad-hoc requests
-
Hours saved: from [6–12] down to [1–3] hours/week (review + annotations)
-
Time-to-decision: decisions move from “next meeting” to same-week in [1–2] key areas
-
Ad-hoc requests: reduced by [30–60%] because definitions and drilldowns are consistent
The win isn’t just time saved; it’s decision reliability. Leadership starts trusting the weekly view because it stops changing shape.
Case example 2 — Multi-squad SEO team (content + tech) aligned on the same scoreboard
Before: content reports vs. tech reports vs. growth reports (three versions of truth)
A common large-org failure: content focuses on publish velocity and topic performance, engineering focuses on crawl/indexation and errors, and growth focuses on traffic/conversions. Each view is “right,” but they don’t reconcile—so prioritization becomes political.
Typical symptoms:
-
Three dashboards, three meetings, three different “top priorities”
-
Engineering asks, “What’s the impact if we fix this?” and SEO can’t answer consistently
-
Content publishes into a backlog of technical constraints (templates, internal links, indexation)
After: shared KPI ladder + role-based views + weekly ops review
They implement one KPI ladder and create role-based views that share the same underlying definitions:
-
Shared scoreboard: outcomes + leading indicators, with the same filters and windows.
-
Role views: content sees cohorts and opportunities; engineering sees health and impact windows; leadership sees the ladder.
-
Weekly ops review: one meeting where exceptions drive actions, not status updates.
Data to include: cycle time from issue → fix, publish velocity, impact attribution window
-
Issue → fix cycle time: reduced from [4–8 weeks] to [2–4 weeks] via clearer impact framing and ownership
-
Publish velocity: improved by [10–25%] after removing recurring blockers surfaced in exceptions
-
Impact windows: documented by initiative type (e.g., templates vs. content refresh), reducing premature “did it work?” debates
The hidden benefit: fewer “SEO vs. Engineering” stalemates because the report explicitly ties technical work to the KPI ladder.
Case example 3 — Category owners across markets (governance + accountability)
Before: regional spreadsheets and late-month surprises
Market/category owners maintain their own spreadsheets and local interpretations. Central SEO gets aggregated numbers late, then spends the last week of the month explaining surprises to leadership.
Typical symptoms:
-
Reporting latency of [10–20 days] after month-end
-
“Surprises” that were visible earlier, but not escalated (no exception routing)
-
No clear owner for anomalies (“someone should look at this”)
After: automated rollups + market-level drilldowns + ownership model
They standardize the KPI contract across markets and implement rollups with drilldowns:
-
Rollups: leadership sees global and region-level trends with consistent definitions.
-
Drilldowns: market owners see their segment, top movers, and required follow-ups.
-
Ownership: every exception has an owner and a due date (ops cadence enforces it).
Data to include: reporting latency, forecast accuracy (directional), SLA adherence
-
Reporting latency: improved from [10–20 days] to [1–3 days] after month-end
-
Directional forecast accuracy: improved because anomalies are flagged earlier (less end-of-month whiplash)
-
SLA adherence: increases when exceptions are assigned and reviewed weekly (not monthly)
The automation playbook: how to implement automated SEO reporting for large teams
This is the repeatable implementation path that avoids rebuilding everything at once. The goal is to pilot MVARS in one area, prove value, then standardize.
Step 1 — Define the KPI contract (metrics, formulas, owners, and “what changed” rules)
Write it down and keep it short. For each KPI, specify:
-
Formula and segments: including brand vs. non-brand where relevant
-
Comparisons: WoW, MoM, YoY (pick only what you’ll actually use)
-
Thresholds: what counts as notable change (e.g., +/- X% or statistically meaningful movement)
-
Owner: who approves changes and fields disputes
Checklist: If two squads compute the metric independently, you don’t have a KPI contract yet.
Step 2 — Map data sources and refresh cadence (what updates daily vs weekly vs monthly)
Large teams break when everything is treated as “real-time.” Build trust by matching cadence to decision type:
-
Daily: health signals and exceptions that need fast response
-
Weekly: execution throughput and initiative progress
-
Monthly/Quarterly: strategic outcomes, planning inputs, and investment narratives
If you’re discussing integrations, keep claims accurate: Go/Organic connects with WordPress, WooCommerce, and Bing Webmaster Tools. For other sources, treat them as potential inputs in your broader analytics environment rather than promising direct connections.
Step 3 — Build stakeholder views and a single narrative template
Build one narrative template and reuse it across audiences with different depth:
-
What changed? (the exception summary)
-
So what? (tie to KPI ladder and business risk/opportunity)
-
Now what? (next actions, owners, due dates)
The key is consistency: stakeholders should recognize the structure every week.
Step 4 — Add exception-based reporting (alerts for anomalies, not more charts)
Exception-based reporting reduces noise. Start with a small set of triggers:
-
Drop alerts: meaningful declines in non-brand performance or critical segments
-
Opportunity alerts: pages/queries gaining traction that deserve investment
-
Operational alerts: backlog aging, cycle time spikes, SLA misses
Each exception should map to a default action: investigate, fix, refresh, publish, or deprioritize.
Step 5 — Connect reporting to action (tickets, content queue, publishing workflow)
Automation is incomplete if insights don’t become work. Define the handoff:
-
From exception → action: create a ticket or queue item with owner and due date
-
From action → measurement: tag initiatives so you can evaluate pre/post windows
-
From measurement → learning: document outcomes and update playbooks
This is where the Operations Gap closes: reporting stops being a weekly artifact and becomes an input to execution.
Step 6 — Run the SEO Ops cadence (weekly review, monthly business review, quarterly planning)
Cadence is the enforcement mechanism for consistency:
-
Weekly: exceptions + actions + owner updates (no slide theater)
-
Monthly: trends, initiative performance, resourcing changes
-
Quarterly: KPI contract updates, roadmap, investment narrative
CTA: Book a 30-day pilot to standardize automated SEO reporting across teams
If you want help implementing MVARS end-to-end—KPI contract, stakeholder views, exception logic, and an operating cadence—use the 30-day pilot to automate SEO reporting and ops workflows as a structured rollout.
What to measure to prove ROI (without over-claiming attribution)
Proving ROI for reporting automation is about documenting both efficiency ROI and growth enablement. Avoid claiming that a dashboard “caused revenue.” Instead, show how automation changed decisions and throughput, then connect that to outcomes with reasonable windows.
Efficiency metrics: hours saved, report latency, meeting time reduced
-
Hours saved/week: time spent compiling, reconciling, and explaining metrics
-
Report latency: time from period end to stakeholder-ready view
-
Ad-hoc request volume: how often teams ask for custom pulls
-
Meeting time: fewer “status” meetings, more decision meetings
Execution metrics: throughput, cycle time, backlog burn-down
-
Throughput: content publishes, fixes shipped, refreshes completed
-
Cycle time: issue detected → prioritized → shipped
-
Backlog aging: how long high-impact items sit without action
Outcome metrics: non-brand clicks, conversions, revenue contribution (where available)
-
Non-brand performance: a strong proxy for incremental growth
-
Conversion measures: only where your analytics can support it
-
Initiative-level pre/post: document the decision, ship date, and expected impact window
A practical approach is to maintain a simple decision log inside your reporting narrative: what changed, what decision you made, when it shipped, and what you saw afterward. That keeps ROI claims grounded.
Common failure modes (and how large teams avoid them)
Dashboard sprawl and metric drift
Failure mode: every squad builds its own dashboard and tweaks definitions to “make it make sense.”
Prevention: enforce the KPI contract. Any new report must reference it. Review changes monthly and version the definitions.
“Automated” reports that still require manual interpretation
Failure mode: numbers refresh automatically, but someone still has to explain the story from scratch each week.
Prevention: bake the narrative structure into the system: exceptions, drivers, decisions, and next actions with owners.
No owner, no cadence, no decisions
Failure mode: automated reporting exists, but nobody is accountable for acting on it—so the organization stops paying attention.
Prevention: assign owners per KPI and per exception type, and run a predictable weekly ops review where actions are tracked.
Next step: install the system (pilot) or standardize your operating model
If you’re struggling with reporting at scale, don’t start by rebuilding dashboards. Start by installing MVARS: a KPI contract, stakeholder views, exception-based reporting, and an execution handoff.
If you want to go deeper on the operating model that keeps this consistent over time (cadence, roles, governance, and accountability), use the SEO Operations Playbook for teams and KPIs as your reference.
CTA: Book a 30-day pilot to standardize automated SEO reporting across teams
FAQ
What is automated SEO reporting for large teams (beyond a dashboard)?
It’s a system that (1) standardizes KPI definitions, (2) refreshes data on a set cadence, (3) produces role-based views, and (4) generates an action-oriented narrative (what changed, why it matters, what we’ll do next). The goal is fewer manual pulls and faster decisions—not more charts.
Which KPIs should large teams automate first?
Start with a KPI ladder: leading indicators (indexation, visibility/ranking cohorts, CTR, content velocity), execution metrics (cycle time, backlog, publish throughput), and outcomes (non-brand clicks, conversions, revenue contribution where available). Automate the few metrics that drive weekly decisions before expanding.
How do you keep KPI definitions consistent across squads and regions?
Create a KPI contract: metric name, formula, data source, owner, refresh cadence, and “what changed” rules. Store it in a shared place, review it monthly, and require any new report to reference the contract to prevent metric drift.
How do you prove ROI from automated SEO reporting?
Prove ROI in two layers: efficiency ROI (hours saved, reduced report latency, fewer ad-hoc requests) and growth enablement (faster fixes, higher throughput, better prioritization). Tie major initiatives to pre/post windows and document decisions made from the reporting to avoid over-claiming attribution.
What’s the biggest mistake teams make when automating SEO reporting?
Automating outputs without automating decisions. If there’s no owner, cadence, and next-action workflow, the report becomes noise. Exception-based reporting (alerts + recommended actions) is usually more valuable than adding more dashboards.
“